
How to adjust college stats — featuring Caleb Wilson vs. Cameron Boozer
Adjusting player stats for age and strength of schedule, and how those adjustments affect this year's top NBA draft prospects

You already know college stats play a vital role when it comes to the NBA draft — a prospect’s numbers indicate his strengths, weaknesses, and future NBA production.
What’s more, statistical draft models — built on college player and team stats — outperform the actual draft order in predicting future NBA impact.
But here’s the challenge: To make those stats work for us, we need systematic ways to compare players and their stats.
Let’s say two players sport almost identical stats, but one of them is a year older: How much extra credit should we give to the younger one?
And what if one player has played against a much tougher slate of opponents? We have to figure out how much of a boost he should get when projecting his future.
To answer these questions, today we will:
Look at prominent members of the current NBA draft class and how their ages and strength of schedule compares.
Explain how to design a model constructed from box-score stats, adjusted for age and opponents..
The results are rather surprising!
We’ll also note which 2026 draft prospects are most affected by these adjustments.
A big shout-out to Bart Torvik, whose publicly available data made this research possible.
Cameron Boozer vs. Caleb Wilson
An example of why we adjust college stats
While the top prospects In the 2026 draft are freshmen, there are some sizable age gaps between them.
Take, for instance, Caleb Wilson and Cameron Boozer: Wilson was born July 18, 2006, exactly one year before Boozer.
While Boozer’s stats are exceptional to begin with, they are even more impressive when we consider that he’s projected to be the youngest first-round pick in this draft — he’ll be among the very few in the one-and-done era to be drafted before his 19th birthday.
Not only that, but Boozer has played against stronger opponents, given that Wilson’s season ended on Feb. 10 while Boozer is still going in the NCAA tournament.
But while it seems rather obvious that Boozer would likely have even better numbers if he were a year older, little research has been done to determine how much better, until now.
In other words, it’s unclear how large the effects of age and schedule really are, and how much exactly we should be boosting or dampening player stats as we evaluate their likelihood of success in the NBA.
But using regression methods, we can determine the size of the effect of age and the quality of opponents on box-score stats.
Today, I’ll explain how to design a model incorporating these effects.
If you want to see how these adjustments affect Cameron Boozer, Caleb Wilson, Darryn Peterson, and other NBA prospects, you can skip the technical sections … or just click here.
The technical details
The regression design
In our series of technical articles, our most recent piece covered how to predict NBA player stats.
How to accurately predict NBA player stats

Player stats are fairly volatile — more volatile than fans realize — as they depend on many external factors and lots of random chance.
Here is a quick recap:
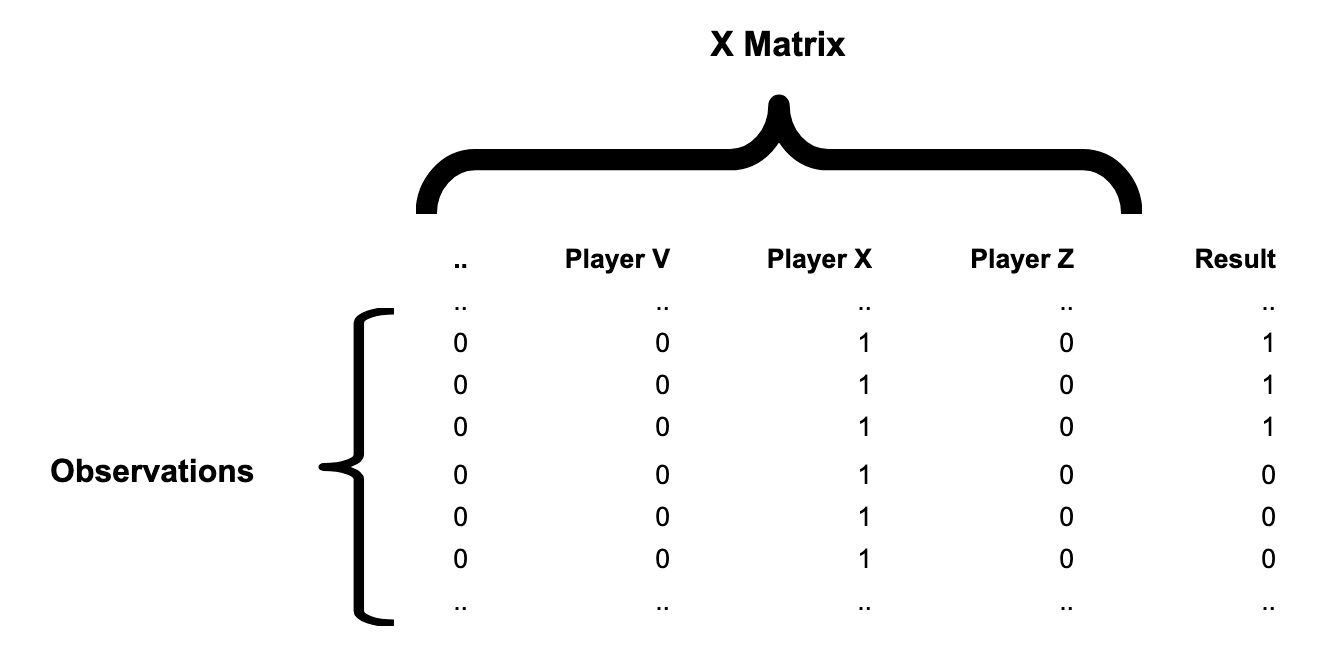
First, we create an X-matrix where the number of columns corresponds to the number of players. If we’re estimating a player’s 3-point percentage, the number of rows in X is the total number of 3-point attempts of all players.
For each 3-point attempt (=1 row), the corresponding column of the shooting player is set to “1”.
The results vector Y — which has as many rows as X — is set to “1” for makes and “0” for misses. For a player who made three of his six 3-point attempts, part of our X and Y would look like this:
Plugging (X, y) into a penalized regression setup, we get a more accurate projection for a player’s 3p%, in contrast to taking his current 3p% at face value.
Adjusting for aging effects
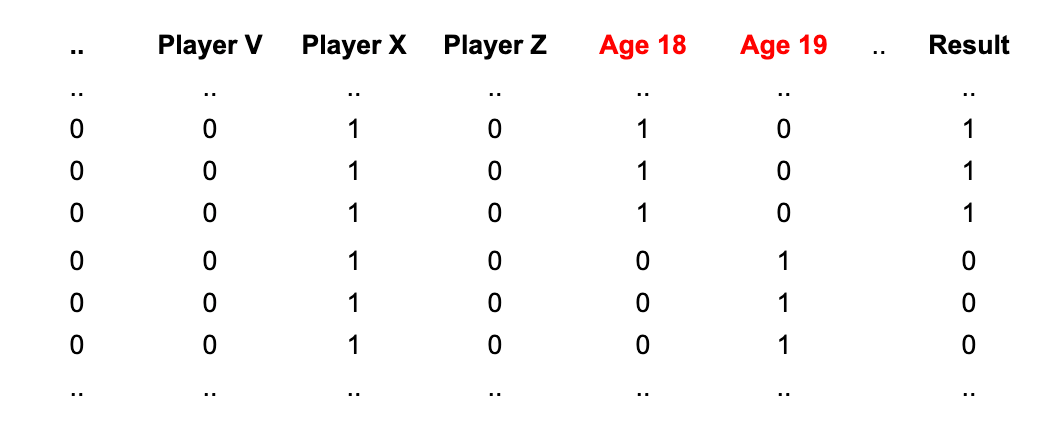
This regression setup is easily extended to account for aging effects:
We create additional variables in our X-matrix, denoting the possible (rounded) ages of the players.
For every 3-pointer taken, we activate the age variable that corresponds to the age of the player at the time of each attempt.
Say that our player’s six 3-point attempts came in different games: Three makes in a game early in the season when the player was (rounded) 18 years old, and three misses later when the player was 19.
Then the new setup looks like this:
Adjusting for strength of schedule
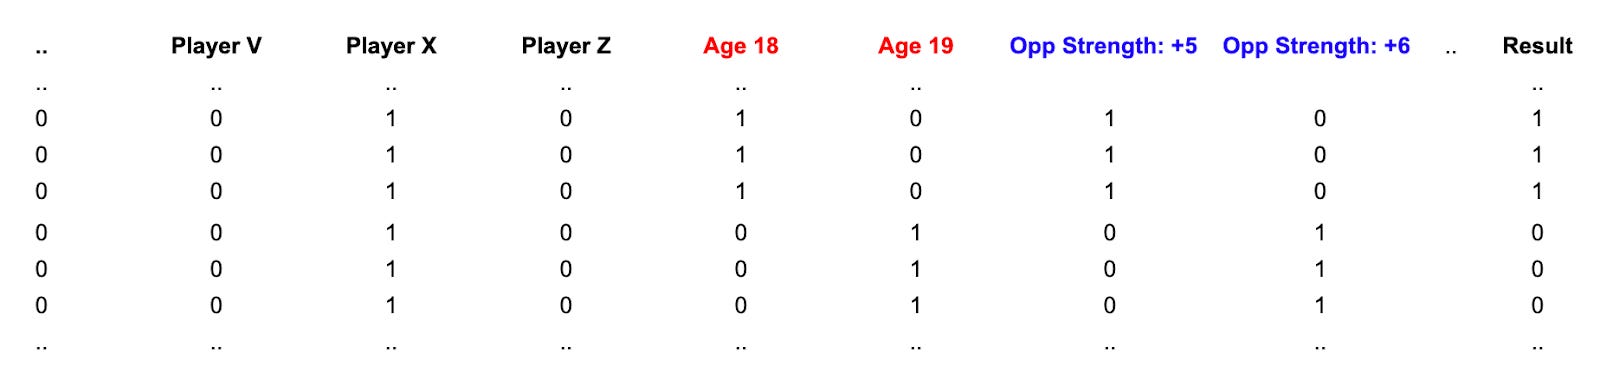
This adjustment works in a similar way:
We first calculate each opponent’s strength.
This can be win percentage, point differential, or something similar to Basketball Reference’s Simple Rating System (SRS), which adjusts for strength of opponent.
We “bucket” the various opponent strengths — for example, we can round to the nearest integer.
We add a new set of dummy variables to X, one for each bucket.
For each shot, we activate the dummy variable which denotes the strength of opponent in that game.
Suppose the opponent in the first game was rated +5, while the second opponent was rated +6.
With this setup, we can estimate aging curves and the effect of opponent quality, for each of the box-score stats.
A quick note: All the players used in this analysis were eventually drafted. This creates a biased sample, and the results would probably look slightly differently if we included all NCAA players. On the plus side, the results will probably be more accurate when predicting stats of future drafted players.
The surprising results
For points per possession, the effect of aging on college players looks like this:
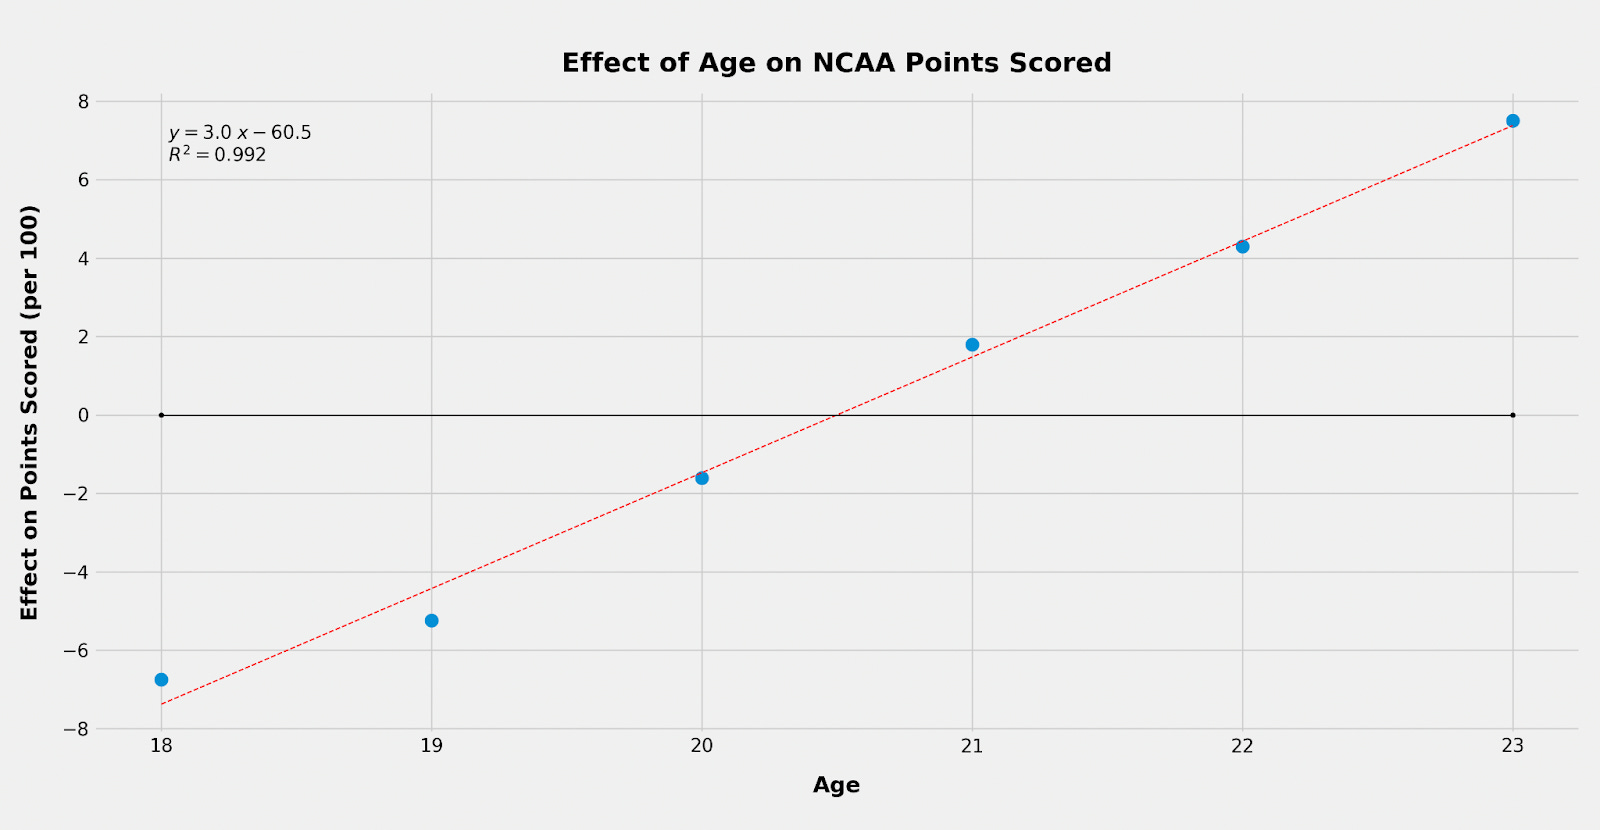
Unsurprisingly, the graph points upward, denoting that NCAA players tend to score more points with each additional year of age.
The surprising part is this:
We might intuit that younger players make bigger leaps, year to year. Any parent or coach has seen how quickly young people can improve in any facet of life.
But for college players, we don’t see that.
Instead of the big improvements coming early in college and then the line looking flatter for older players, the improvement shown is remarkably linear, suggesting that the effect stays constant through at least age 23: A player is expected to score 3 points more (per 100) with each additional year of age.1 2
Here are the aging curves for assists, steals, blocks, rebounds and 3-point percentage:
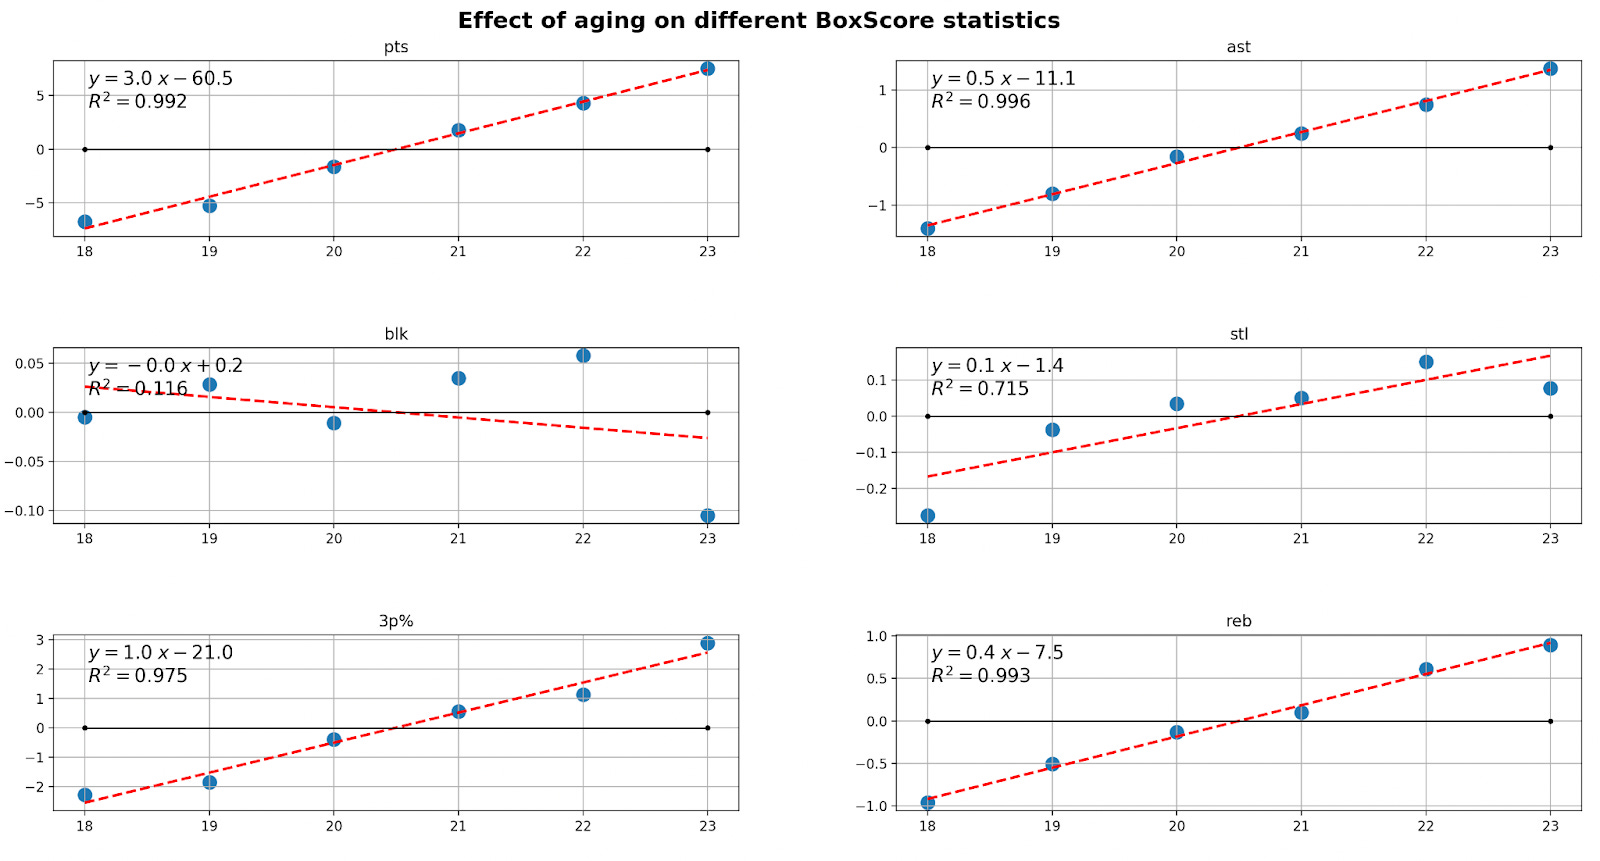
Interestingly, blocks don’t see any increase with age — perhaps that is because this is the stat most dependent on raw athleticism, which might peak around age 18. Another explanation could be that players learn to contest shots by standing or jumping straight up, which can stymie opponents while creating fewer fouls — and fewer blocked shots.
For the other stats, the analysis suggests that with each year of aging, an NCAA player tends to gain:
3 more points (per 100 possessions)
0.5 assists
0.1 steals
0.4 rebounds
1% of increased 3p%
And here’s a chart denoting the improvement, in percentage, over the baseline (18 years old).
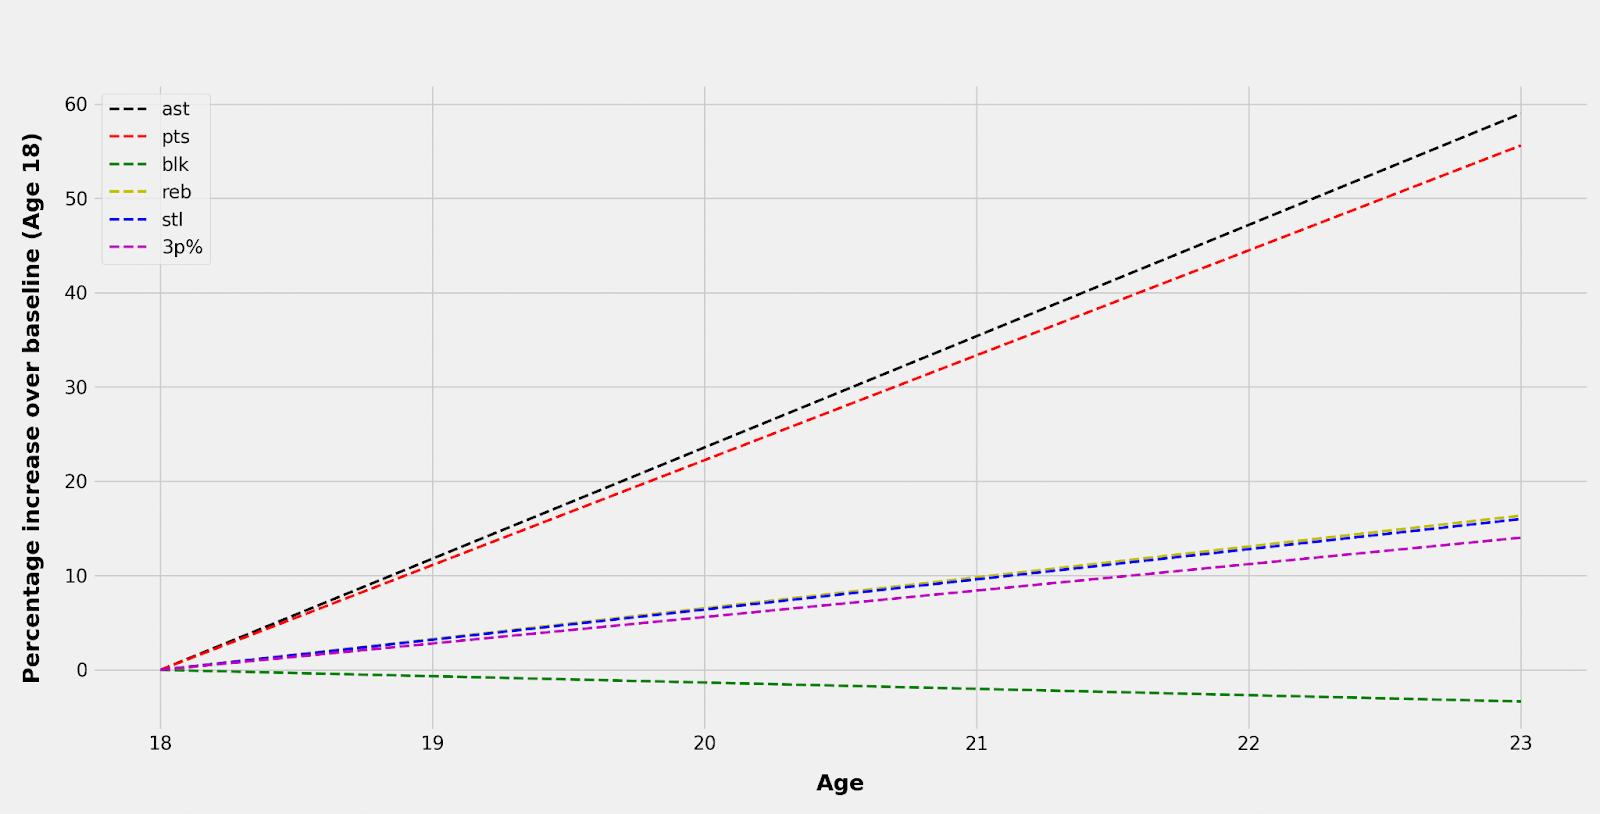
Points and assists rise almost 60% from age 18 to 23.
Rebounds, steals and 3p% rise by around 15% over the same timeframe, while block rate sees a small decline.
For the effects of opponent quality, the graphs looks like this:
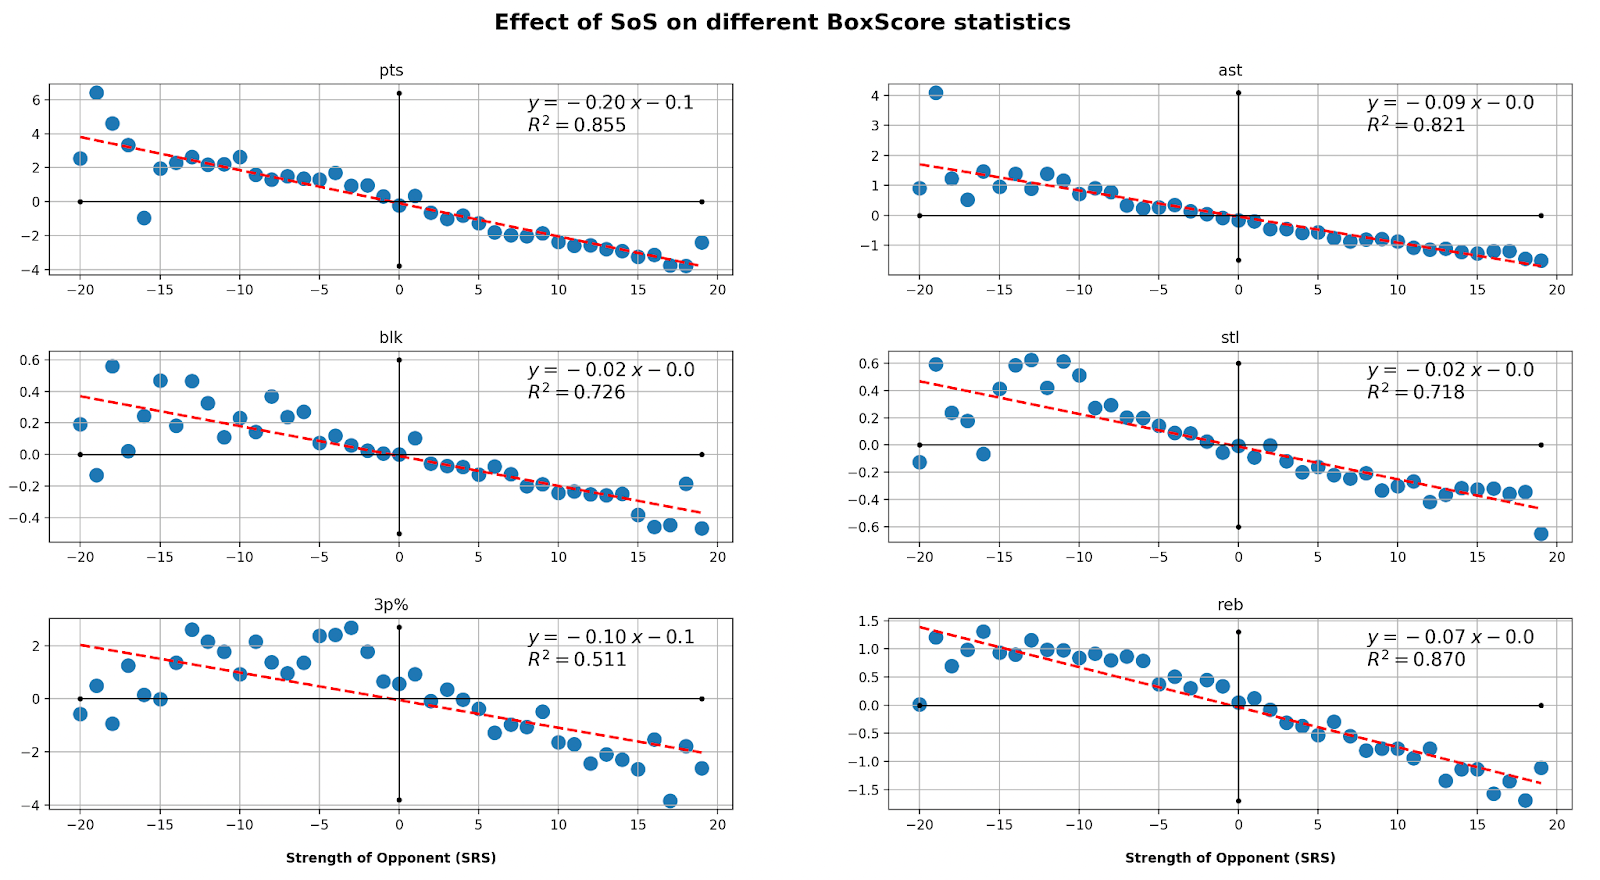
As expected, all of these stats decline when playing against stronger opponents.
Playing a team like Houston or Duke — compared to an average opponent — will reduce stats by these amounts:
Points by around 5 per 100 possessions
Rebounds and assists by 2
Blocks and steals by 0.5
3p% by 2.5%
Armed with these results, we can answer this basic question: What would everyone’s stats look like if they were the same age and played against the same quality of opponents?
How this impacts Boozer and Wilson
To make these adjustments, we first have to calculate each player’s (possession-weighted) average age, and their individual strength of schedule.
For Boozer and Wilson, it looks like this:
Boozer — Average age: 18.5. Strength of schedule: +8.0
Wilson — Average age: 19.5: Strength of schedule: +5.8
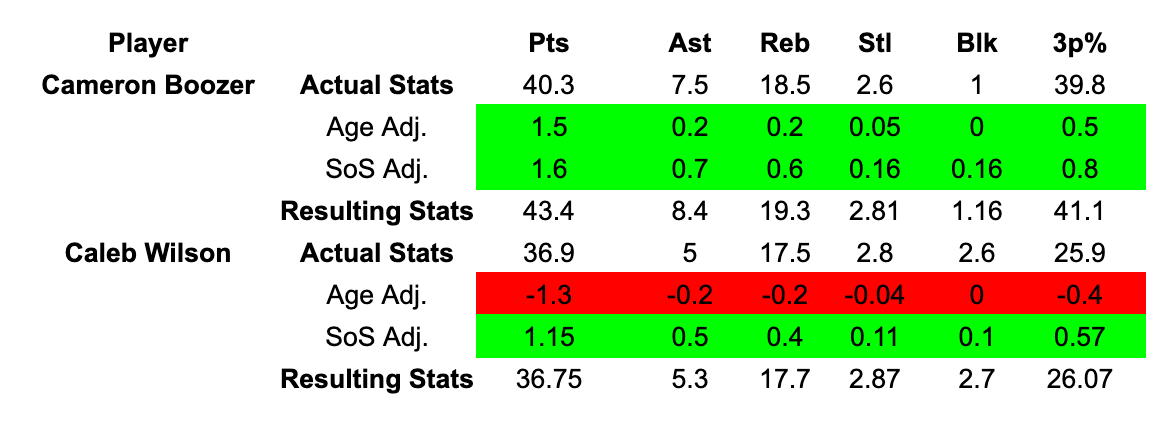
Here are the projected stats for Boozer and Wilson if both players had been exactly 19 years old for every game and were playing average NCAA opponents each night.
As you can see, Boozer gets a decent-sized boost in his “Resulting Stats” line, while Wilson’s age- and schedule-related adjustments mostly cancel each other out.3
... and some other prospects in this draft class
If we use these adjustments for projected first-rounders of this current class, these are the players who get the biggest bump:
Darryn Peterson has played the toughest schedule, with an average opponent SRS rating of +9.8. His points per 100 possessions would thus see a bump of around +2.
On the other end of the spectrum, Bennett Stirtz’ opponents are rated at only +5.5, followed by Joshua Jefferson’s (+5.7) and Caleb Wilson’s (+5.8).4
Cameron Boozer, Chris Cenac and AJ Dybantsa would see the biggest positive age adjustment.
Yaxel Lendeborg — with a possession-weighted age of 23 — would see his 27.4 points/100 drop to around 15 using the above method.
This is potentially related to the selection bias mentioned earlier: The older players in our sample might’ve been drafted in part because of continuous improvements.
Most players in the sample ended their college career by age 22. If players continued to play college ball, the curve would eventually flatten at some subsequent point.
Stats as of March 26.
While the average strength of schedule for college players overall is zero, strength of schedule among draftees is nearly +7.
 | A guest post by
|
So boozer is better than ppl think
And yet..Stirtz is still playing. Peterson is not. I think strength of schedule is pretty fluid. Is Iowa as mediocre as stats had them early? Also .Fleming is gone, scuff...playing what is close to an NBA team last night...got badly pushed around. The numbers don't look on paper THAT bad, but the hogs could play no defense Vs a bigger more mature Arizona team. For me, this is why Stirtz should be higher ...he controlled the game vs Nebraska. Fleming ..like acuff...could not. Illinois size was the most significant factor. And these feel like intangibles. One outlier is Braden smith...only 6 feet even. But Purdue won. Smith keeps winning.