
Adjusted Plus-Minus, Explained: The Stat That Drives Modern Basketball
A simple explanation of a complex metric

At the heart of modern NBA analytics lies one essential concept: Adjusted Plus-Minus (APM).
APM and its related models help reveal who the best players truly are, and who might be overrated. These tools guide NBA decision-makers, award voters, bookmakers, and bettors alike — and inform fans trying to understand the game more deeply.
Today we’re releasing two pieces: a technical deep dive into how APM works, and this one — a lighter read — designed to give you a clear overview of this cornerstone of modern basketball analysis.
Game statistics are only an imperfect measure of many of the contributions that players make to winning.
— Dan Rosenbaum, “Measuring How NBA Players Help Their Teams Win,” 2004

The box score isn’t good enough
Even if we could watch all 1,230 NBA games in a season, the eye test would fall short. Even if we evaluated every action perfectly, it’s nearly impossible to compare hundreds of players across 30 teams using the eye test. And no one watches every game anyway.
The small samples we do see are misleading — players might try harder on national TV, for instance. And highlights influence how we see teams and players.
Counting stats help, but they also capture only part of the picture. A player might rack up points and rebounds, but what about more subtle influences on winning and losing?
For instance, what about the player who gets back slowly on defense, argues with refs, or fails to communicate? Box scores barely register these impacts, yet teammates feel them, effectively playing 4-on-5.
Furthermore, we humans still don’t have a perfect intuitive grasp of exactly how to evaluate every action on the court — for instance, how to value a steal, a block, a rebound. And those actions are easy to see. What about screens and boxouts? What about quick rotations to prevent 3-point shots?
As APM pioneer Wayne Winston told the New York Times in 2003: “Ninety percent of basketball is made up of things there aren’t stats for.”
That remains roughly true even though we now have more data than ever for individual players, including the fruit of the NBA’s tracking data — such as deflections, which we have for the past 10 seasons.
Adjusted Plus-Minus (APM) addresses these gaps. It rates players according to their actual impact on team performance, including scoring margin, quantifying what was once unmeasurable. APM puts players on an objective scale, showing who truly helps their team win — often with plays that don’t show up in the highlights.
In short, the box score tells only part of the story. Advanced metrics reveal the hidden contributions that matter most: the ones that make a real difference in winning.
APM: Brief history of the first 25 years
APM was first developed in the early 2000s by Wayne Winston and Jeff Sagarin — under the name WINVAL — with the support of Dallas Mavericks owner Mark Cuban. But the results remained private.
Dan Rosenbaum — later hired by the Pistons, Cavaliers and Hawks — introduced APM to the public with this 2004 article for 82games.com.
Steve Ilardi, who would later work for the Suns and other franchises, and Aaron Barzilai, later with the 76ers, pushed the enveloped by providing raw data and continuously updated results.
The next big breakthrough came in 2010, when Joe Sill presented what became known as RAPM — an improved version of APM — at the Sloan Sports Analytics Conference, winning the prize for best paper.
When the Wizards hired Sill for their analytics department, I picked up the baton, further developing RAPM and its offshoots, including Real Plus-Minus for ESPN, xRAPM, and more.
These are just a few of the new variations of APM that have been made available at various sites in the past 15 years. And NBA teams, bettors, bookmakers, and the like have developed their own proprietary versions as well.
How APM works — a simple example
Imagine walking into a gym for a 2-on-2 tournament. You’re paired with a random teammate, and everyone else has played together many times before.
From those prior games, we already know each player’s impact on team scoring margin — that is, how much they tend to help (or hurt) their team’s point differential.
An average player rates at 0.0, while positive numbers indicate players whose presence consistently moves the scoreboard in their team’s favor.
Now, let’s make it concrete. Here’s an example using well-known NBA players:
Suppose you are teamed with Nikola Jokić and your team wins by 2 points against elite opponents Shai Gilgeous-Alexander and Chet Holmgren. Because their total rating is 1 point better than Jokić’s rating in this hypothetical example, the model would assign you a rating of +3. That’s the amount by which the result exceeded what was expected.
In a second game, if you teamed with James Wiseman and beat Kyle Kuzma and Jordan Poole by those same 2 points, your rating would actually be -1. Once again, that’s the gap between the expectation and the outcome.
That’s the “adjusted” part of Adjusted Plus-Minus — it accounts for the quality of your teammates and opponents.
In the above examples, Jokić’s rating would see a slight positive shift and Wiseman’s rating would see a slight negative shift — the exact size of the shifts would depend on how many games they’d previously played.
As games and possessions start to add up, noise fades and true impact emerges.
Scaling up to the NBA
In the NBA, the logic is identical — just scaled up:
Roughly 500 players are tracked.
Instead of 2-on-2 results, APM runs on each 5-vs-5 possession — about 200 per NBA game.
We can separate offense and defense, giving each player two ratings: one offensive, one defensive.
Of course, small samples are noisy. A few hot (or cold) nights can skew results early — just like in our 2-on-2 gym.
Consider that the Sacramento Kings ranked fifth in point differential after only four games last season. Early numbers can deceive; stability takes time.
The rise of RAPM
How do we combat this noisy data?
During your first several games, the rating of you – a player who came into the tournament as someone of unknown strength – can bounce around wildly from game to game. Earlier implementations of APM dealt with this issue by simply bucketing players who hadn’t played enough minutes, treating them as a single entity until they reached a certain minute-threshold.
But there’s a better solution: We start by assuming that new players are of roughly average strength. Then, using a modified version of APM, we allow ratings to move away from that average only when enough data exists to justify that.
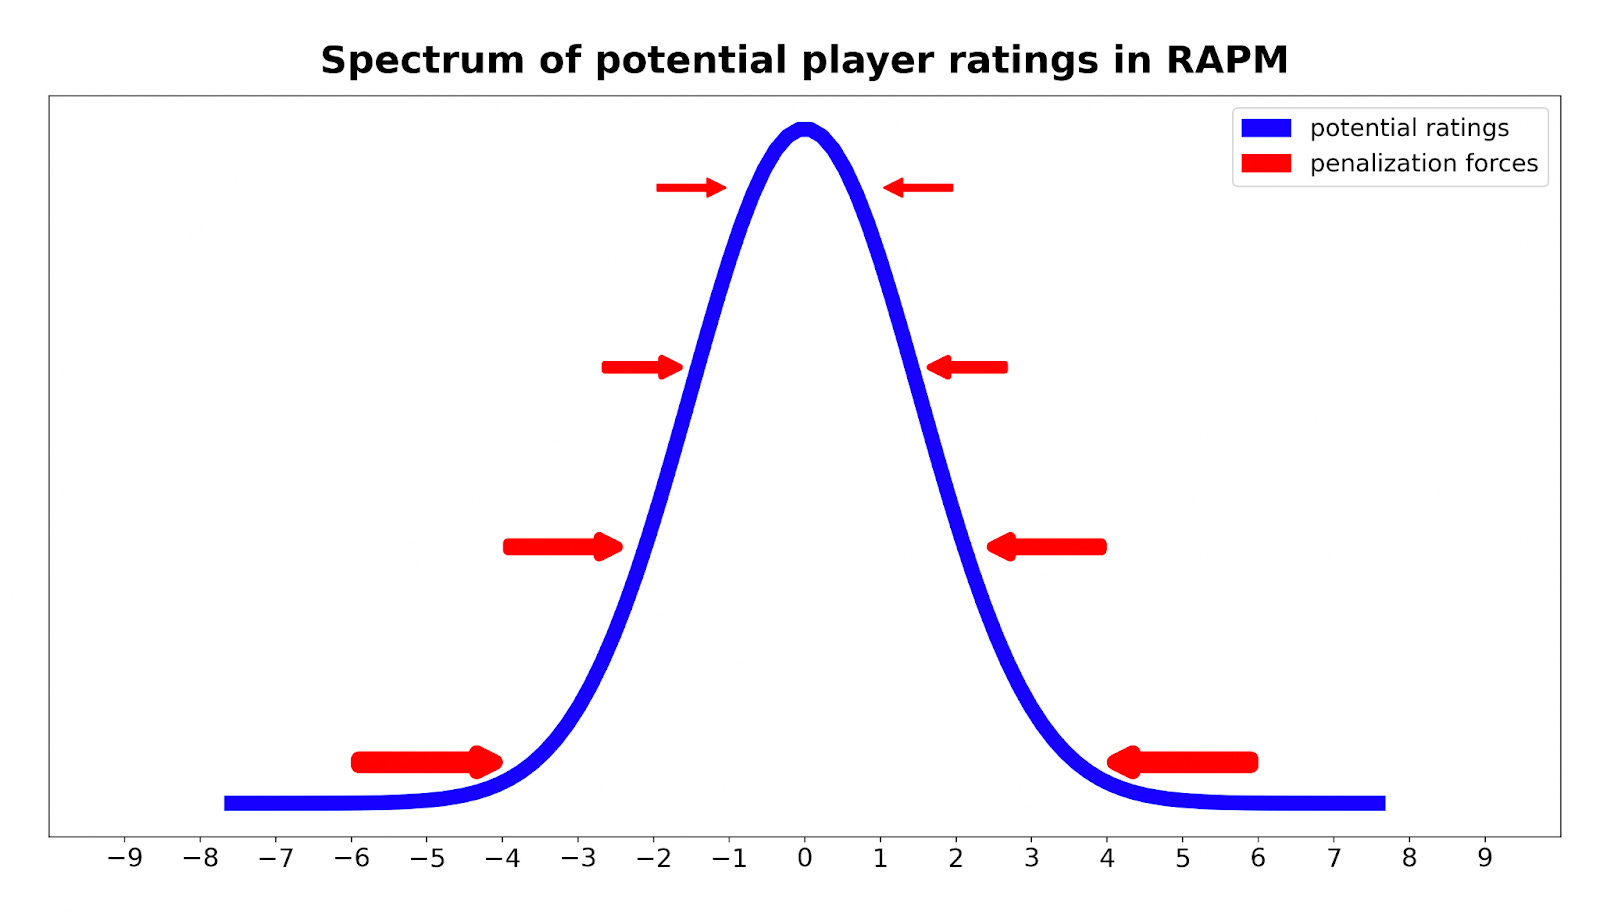
The more a player’s rating “tries” to move away from 0.0, the more the algorithm pulls it back toward zero. While this effect applies to every player, it has more impact on players for whom we have less data.
This method is called RAPM, with the “R” standing for regularization. The force we’re pushing with is called the “penalization value” — which stabilizes ratings by preventing small samples of data from creating fake superstars or scrubs.
Fortunately, this “penalization value” is one we can compute scientifically, using a method called “cross-validation.”
In a setup that’s pure noise — say, a setup where scoring in a possession is determined by a coin flip — penalization would come out to infinity: We wouldn’t gain any predictive power by assigning players different ratings, and all ratings would get pushed toward zero by an infinitely strong force. On the other hand, if the data were absolutely noise-free — with no randomness — penalization would be zero, and player ratings would be allowed to take on any value.
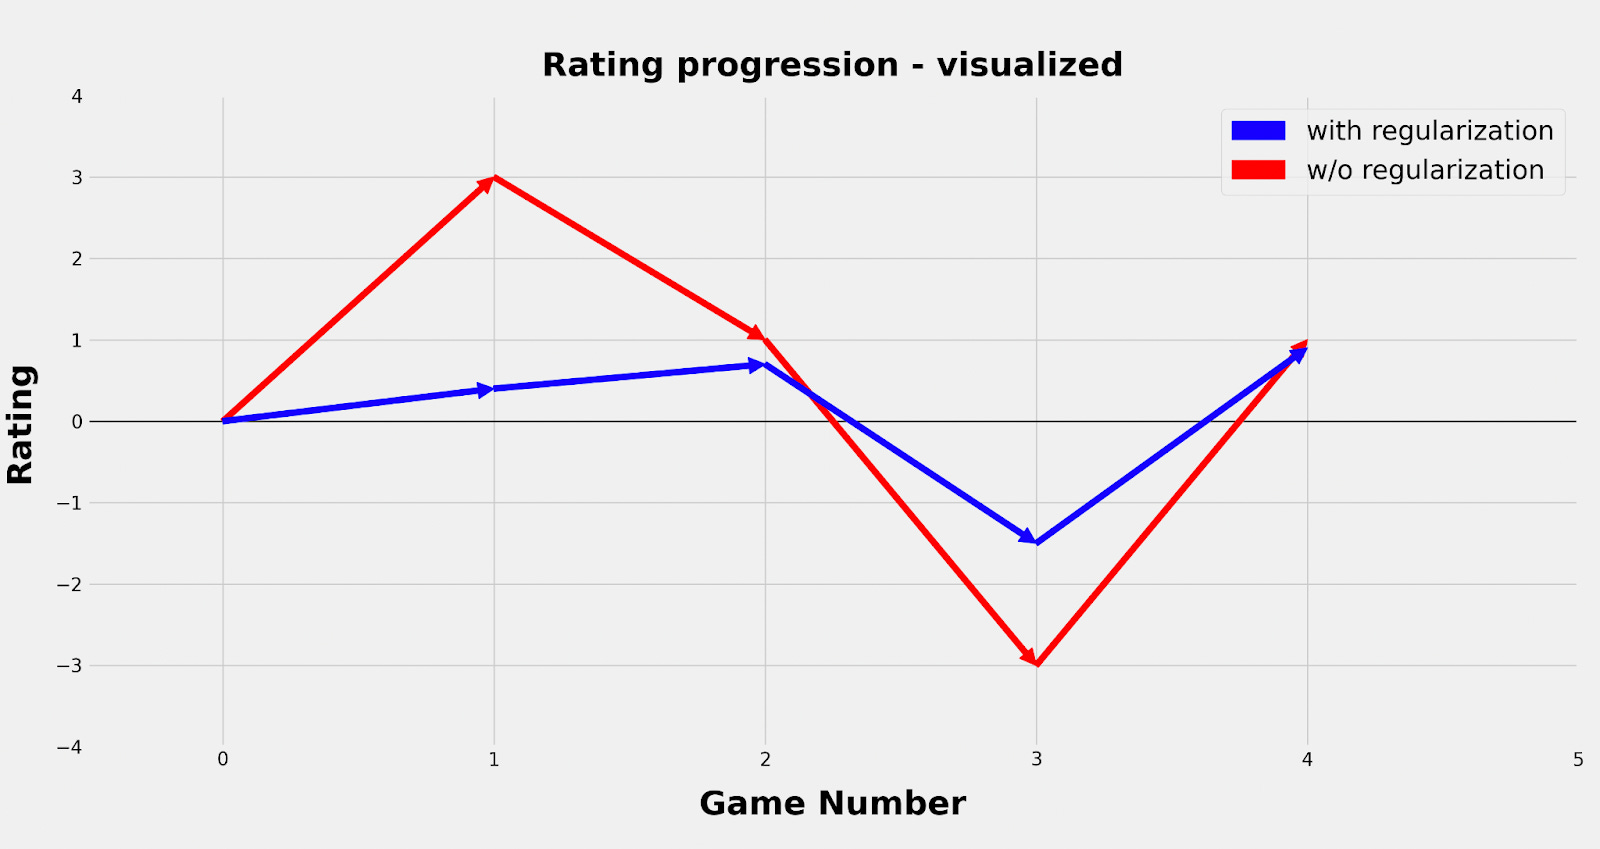
As the example below shows, when we apply this method to our 2-on-2 setup with fictional game results, ratings stabilize — they don’t swing wildly from game to game the way they would without regularization:
It should be noted that this dampening effect doesn’t just shrink everyone’s rating by a constant factor. Because it affects ratings of teammates and opponents, it also changes expectations for every 5-on-5 matchup. As a result, the players’ ranks can come out significantly different from standard APM.
Being less affected by noise, RAPM does a far better job of predicting what will happen next and strongly outperforms APM in accuracy.
Expanding the model: beyond teammates and opponents
The example above adjusted for the strength of teammates and opponents. But in theory, we can go further and account for several other factors as well, such as home-court advantage, days of rest, and coaches.
And we have previously shown how to account for the state of the game — called the “rubber-band effect,” which indicates players are more motivated when behind in a game, as laid out by Matthew Goldman and Justin M. Rao.
RAPM can also be computed over wildly different timeframes:
Single-season results tend to be quite noisy, especially early in the season, but can offer insight into short-term trends that sometimes do hold. Because of the smaller sample size, these results fluctuate the most and should be viewed with a larger grain of salt.
Despite that volatility, a good portion of this season’s RAPM results pass the smell test, ranking SGA, Jokić, Giannis Antetokounmpo, and Donovan Mitchell in the top five.
But things do diverge quickly from public consensus, with Ajay Mitchell, Hugo González, Alex Caruso, and Miles McBride appearing in the top 10. These are players worth watching to see whether their better-than-expected ratings hold up, this year and in future seasons.The version that tends to perform best — at predicting the future — uses two to three years of data, with the most recent season weighted more heavily.
Because RAPM generally values defense more highly than the public does, we see some less-famous names near the top. For instance, 3-year RAPM rates the following players as having a top-25 impact per possession: Zach Edey, Franz Wagner, Jarrett Allen, Ajay Mitchell, Chet Holmgren, Brandin Podziemski, Deni Avdija, Alex Caruso and Rudy Gobert. Of those nine, only Allen and Gobert have made an All-Star team.Finally, there is a version that uses all the play-by-play data that has been made available: 30-year RAPM, ranging from 1996-97 to now. This helps rank historical greats and identify up-and-coming impact stars early. Those results indicate that Kevin Garnett, for instance, deserves even more respect within the NBA community, ranking third overall among more than 2,500 players.1 Similarly, this analysis is a huge fan of Manu Ginobili (9th) and Draymond Green (tied for 12th).
What about the other end of the spectrum — players who regularly forget to do the little things, like boxing out? Several high-usage guards fall into this group, giving up more points on defense than an average NBA defender. LaMelo Ball and Trae Young — point guards whose impact has been questioned — are among them.
From RAPM to modern metrics
There is only one step left to get from RAPM to current state-of-the-art player metrics, such as xRAPM: incorporating box-score information.
In the absence of individual player stats, RAPM simply starts out assuming all players are average (0.0), as explained above.
Then, because of sample-size limitations, noise, and penalization, it can take time for the algorithm to uncover a player’s “true” impact — especially when that player is either great or really bad.
However, physical profiles and box-score statistics — even when the sample size is limited — can provide valuable clues.
For example, a 7-footer with a high block rate, low free-throw percentage, low assist rate, and low 3-point rate is more likely to be a defensive positive and an offensive negative, while the reverse might hold true for someone with Trae Young’s statistical profile.
Multiyear RAPM, then, helps us determine the value of various individual stats by providing an objective, bias-free rating that serves as an anchor. Over time, RAPM, combined with machine-learning algorithms, allows us to identify which statistical player profiles correspond to specific types of offensive and defensive impact. This process ultimately leads to box-score-based impact metrics such as Basketball Reference’s Box Plus-Minus (BPM).
Not using APM for this step would mean foregoing the power of machine learning — and relying instead on subjective human input, which inevitably makes any metric less accurate.
As mentioned before, these box-score-based metrics suffer their own set of problems. The solution? Combine the two approaches, taking advantage of quicker stabilization (via the box score) while still identifying players who are true difference-makers thanks to doing the little things (via APM).
This combined method was first laid out by Dan Rosenbaum. Eventually, I modified it to create what became known as ESPN’s Real Plus-Minus. Other modern metrics — L.E.B.R.O.N., DARKO, EPM, and my own xRAPM — follow a very similar, if not identical, approach.
Most of Michael Jordan’s career occurred in the years before play-by-play data became available.
 | A guest post by
|
I was surprised by Garnett's third place ranking! Amazing how such an all-time great can still be underrated.
No surprise to see Westbrook battling for DFL!