
An NBA first: Introducing standard errors for box-score metrics
Your favorite advanced metrics are missing this basic statistical information

Believe it or not, your favorite advanced NBA metric — whether BPM, EPM, LEBRON, DARKO, Net Points or my own xRAPM — is uncertain about the estimates it spits out.
In the stats world, measures of uncertainty are known as standard errors and confidence intervals.
Why would an analyst want these measures? Why would an NBA team?
NBA decision makers can use them to decide whether to swing for the fences in acquiring a player or take a more conservative route. These measures also allow us to calculate the probability that one player is truly more impactful than another.
But while we sometimes see standard errors reported for NBA metrics based purely on lineup data, nobody reports them for metrics that include box-score data.1
While it’s not an easy undertaking, it is possible to compute these standard errors for every modern NBA metric.
Here’s how it’s done:
How it all started
Among modern NBA metrics, there are essentially three main types:
Lineup metrics, such as Adjusted Plus-Minus (APM and RAPM2).
Box-score metrics, such as Box Plus-Minus (BPM)
Hybrids
For the original APM, it’s very easy to come by standard errors and confidence intervals. The method used by APM, known as ordinary least squares regression, spits all that information out together with the estimates.
But APM is too heavily influenced by noise, leading to weak predictive power, so the analytics world moved on to its more accurate cousin: RAPM.
RAPM uses penalization, which makes it more accurate. But it also cost us the ability to calculate standard errors easily.
At the 2011 NESSIS3 at Harvard, a statistical analyst for the Spurs told me that he preferred box-score metrics because we didn’t know the level of uncertainty in RAPM. Of course, what he didn’t recognize is that standard errors also exist in box-score metrics.
But now we’ve come full circle. While we were eventually able to estimate standard errors for RAPM — through my own simulation method, or Justin Jacobs‘ — no one has successfully computed standard errors for box-score metrics.
How box-score metrics work
Here’s a simplified overview of how most box-score metrics create player ratings:
(1) Use multiyear RAPM as the target variable, and (2) use multiyear player stats as independent variables, in order to (3) generate weights (coefficients) for all stats.
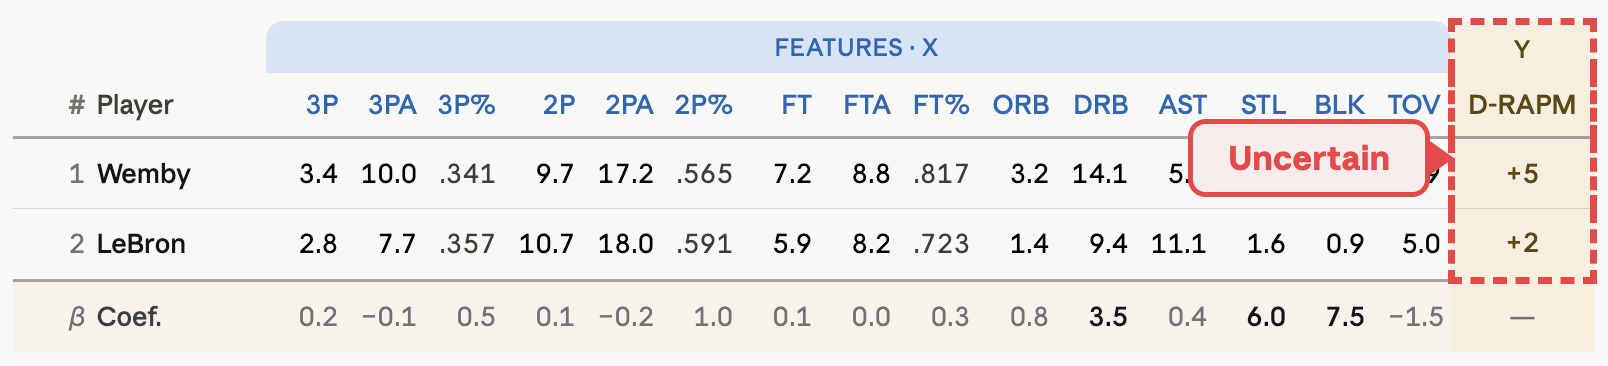
So far, the setup might look something like this:4
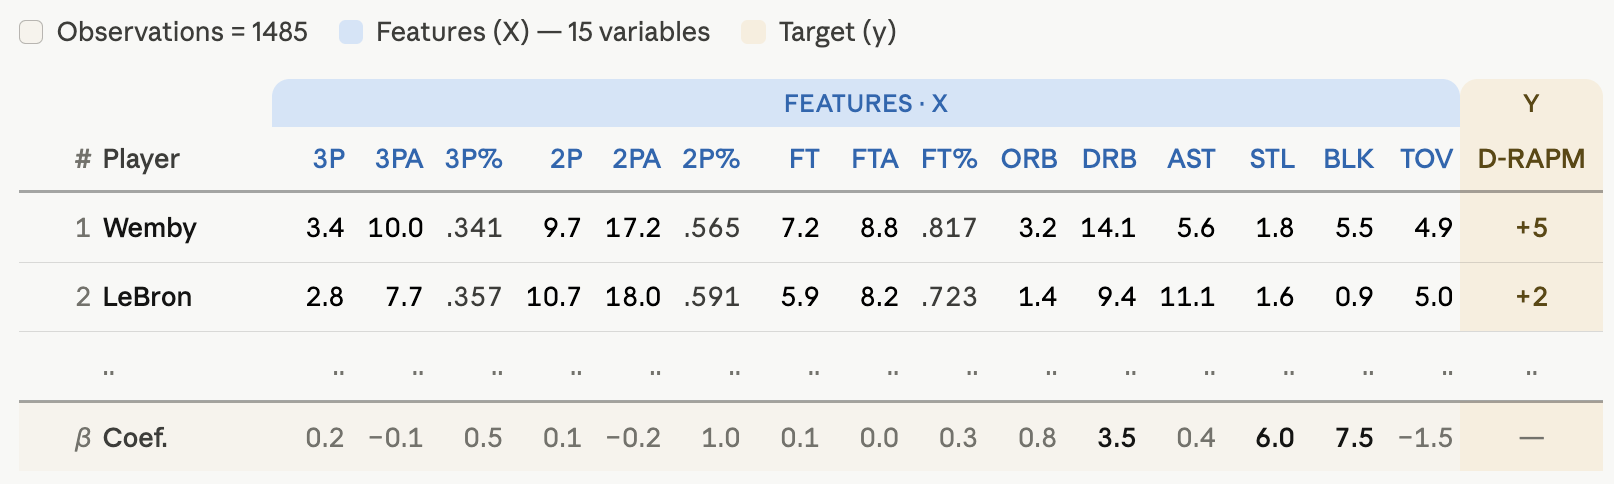
Then (4) multiply the found weights with more recent player stats, and (5) sum up to arrive at a final rating.
For more, see this article:

The different causes of inaccuracy and uncertainty in box-score metrics
Box-score metrics have uncertainty attached to them implicitly, just like other metrics. But that’s not an obvious fact, so let’s start with a simple example:
1. All the inputted player stats are uncertain
Box-score metrics multiply the player’s stats — such as 3-point percentage — with a weight.
Let’s say a player starts his career by making 5 of his first 10 3-point attempts.
For his 3-point percentage, box-score metrics plug in either 50% or a number that regresses to the league-wide mean.
But we don’t know this player’s true skill, and we’re just making a best guess. The reality is that many possibilities exist at the same time: The player might be a 37% 3-point shooter, but there’s a (slightly lesser) chance that he’s actually a 35% or 39% shooter.
This problem exists across all player statistics.
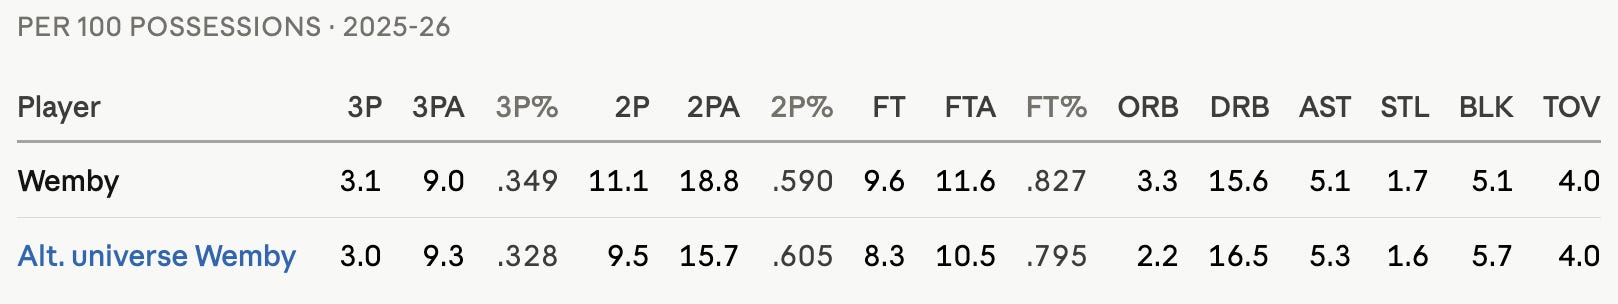
For example, let’s put Victor Wembanyama in an alternate universe, with a basketball environment exactly like the NBA.
His stats would be different, even if his skills were exactly the same. The numbers would change simply because of random chance.
In other words, if you replayed the entire NBA season, everyone’s stats would be a little different than they are right now, just by random fluctuation.
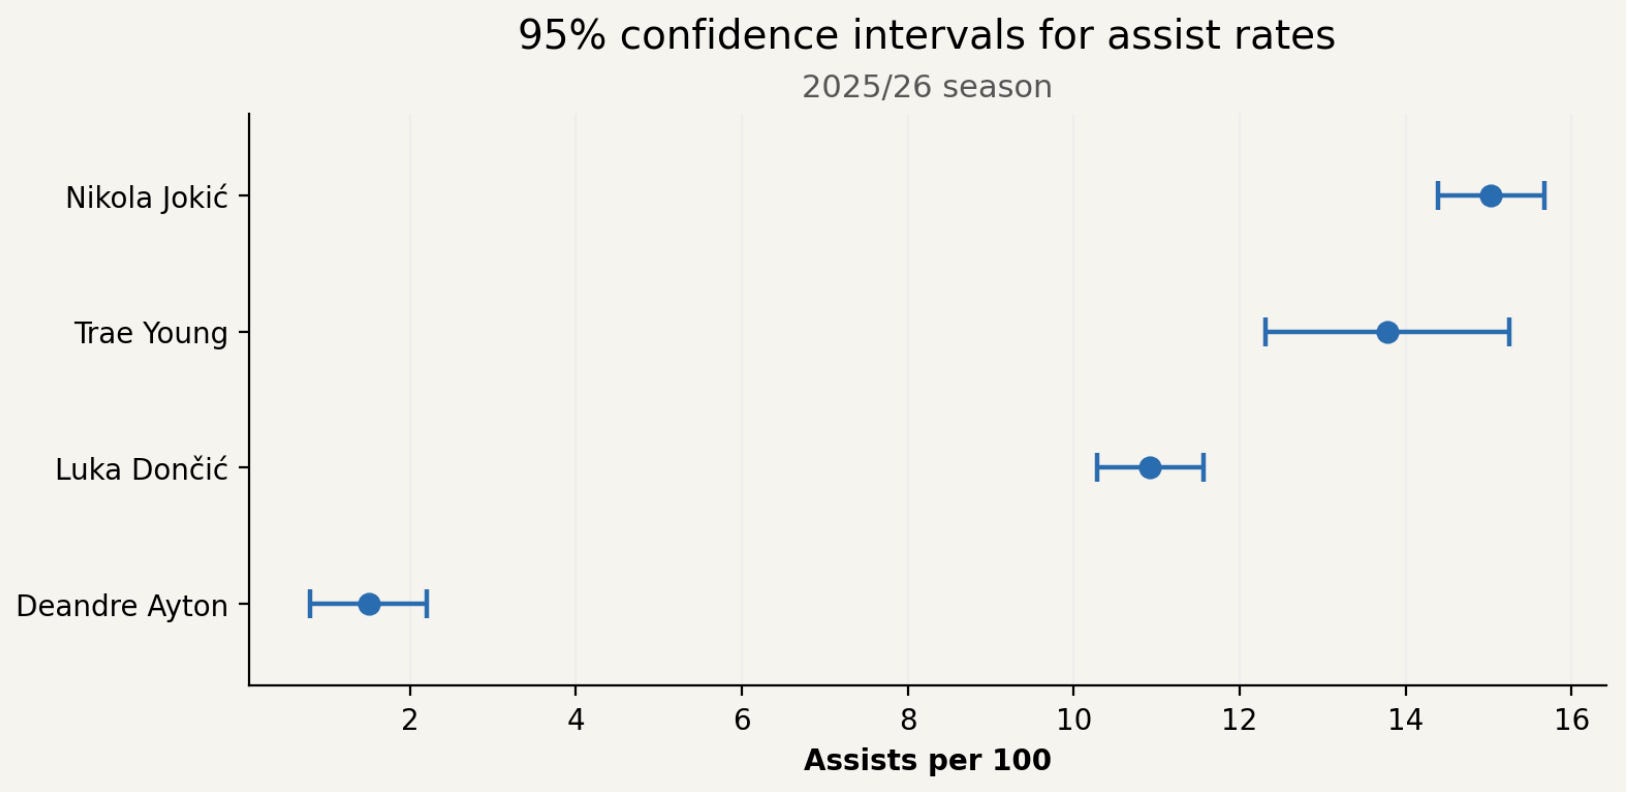
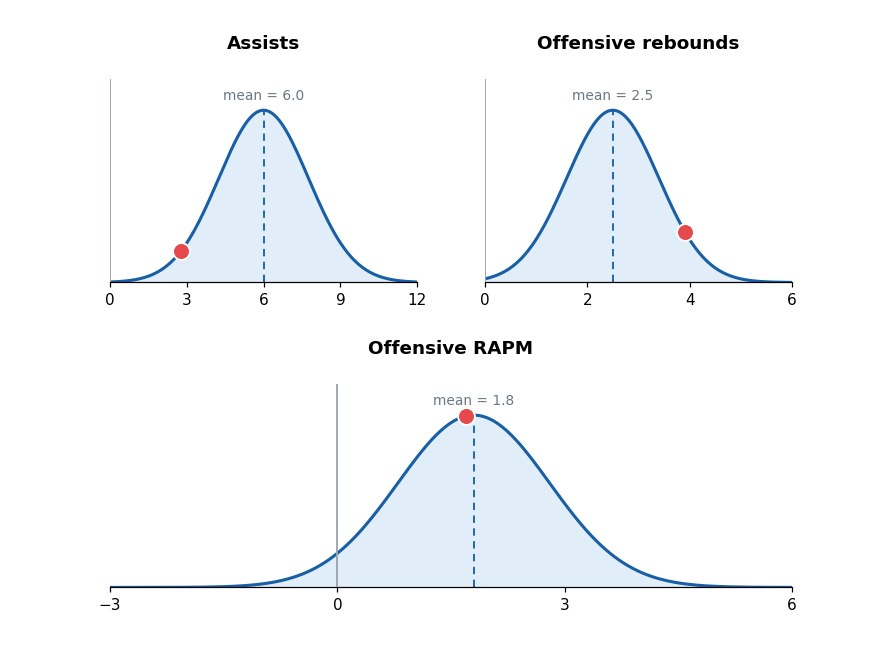
Generally, we are more certain about the stats of a player who has played more minutes and taken more shot attempts from the various distances. In the example above, the range of possibilities is narrower for someone who made 10-of-20 3s rather than 5-of-10.
Here is a chart displaying the uncertainty around player’s assist rates:
How to determine these estimates and bounds is described here:

2. The model weights are uncertain
Box-score metrics multiply the players’ stats with a weight.
Above, we’ve established that stats have uncertainty attached to them. And the same is true for the weights.
This aspect was accounted for when Dan Rosenbaum ran the first-ever statistical plus-minus, though he didn’t account for the other aspects we are mentioning today.
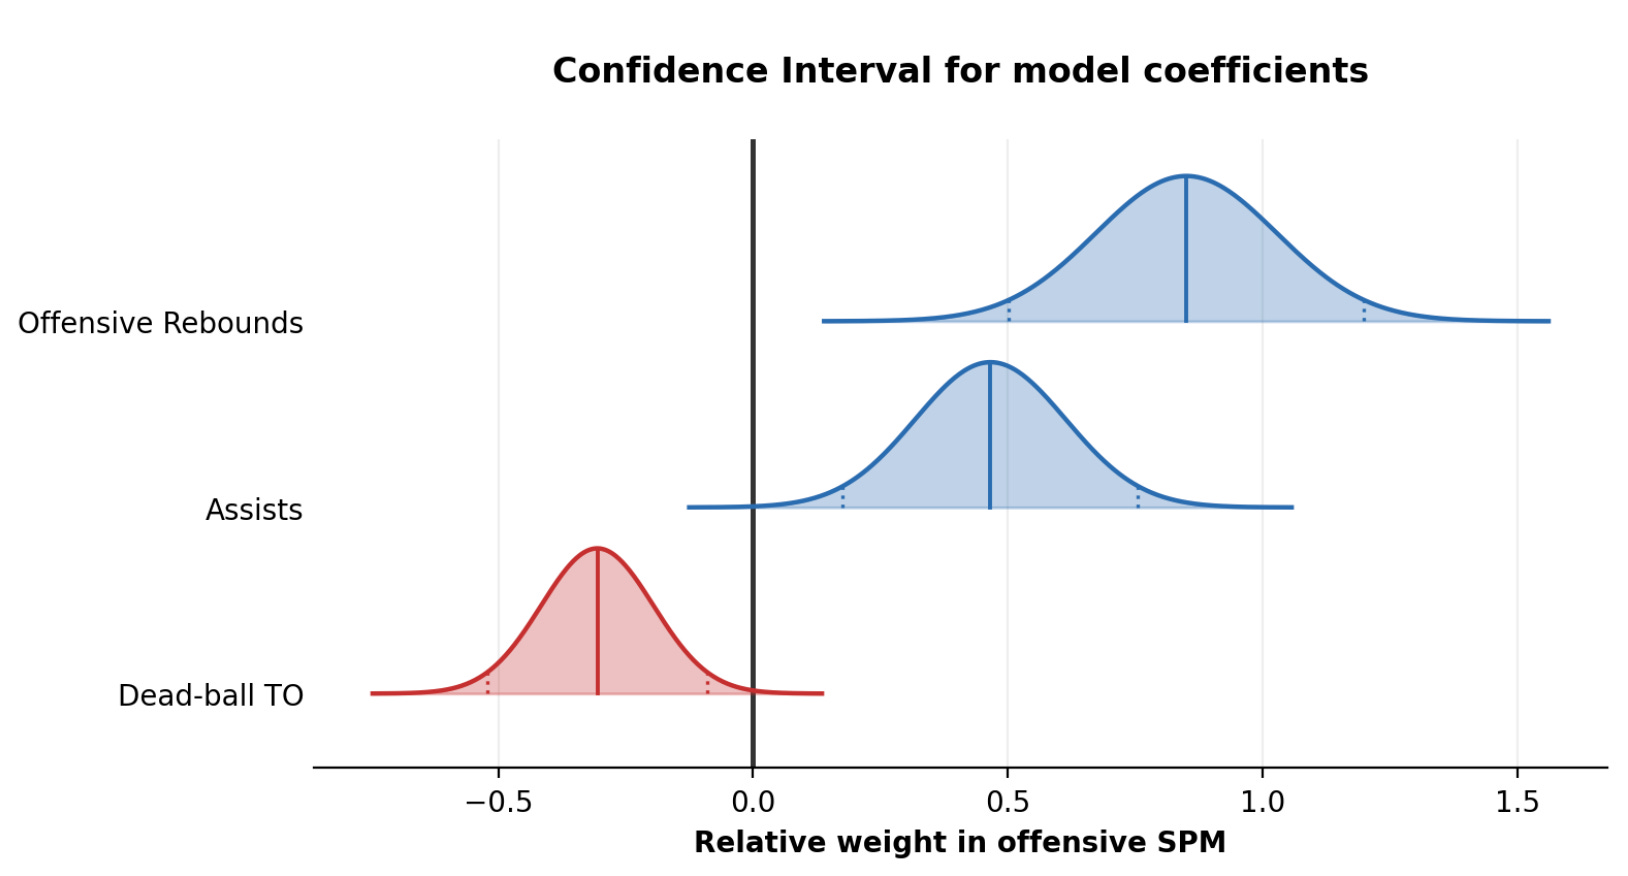
The weights might, for example, imply that an offensive rebound is worth twice as much as a defensive rebound.
But, once again, that represents only a best guess. Instead of a weight of exactly 2.0, it’s very likely the relative weight of an offensive rebound is 1.9 or 2.1.
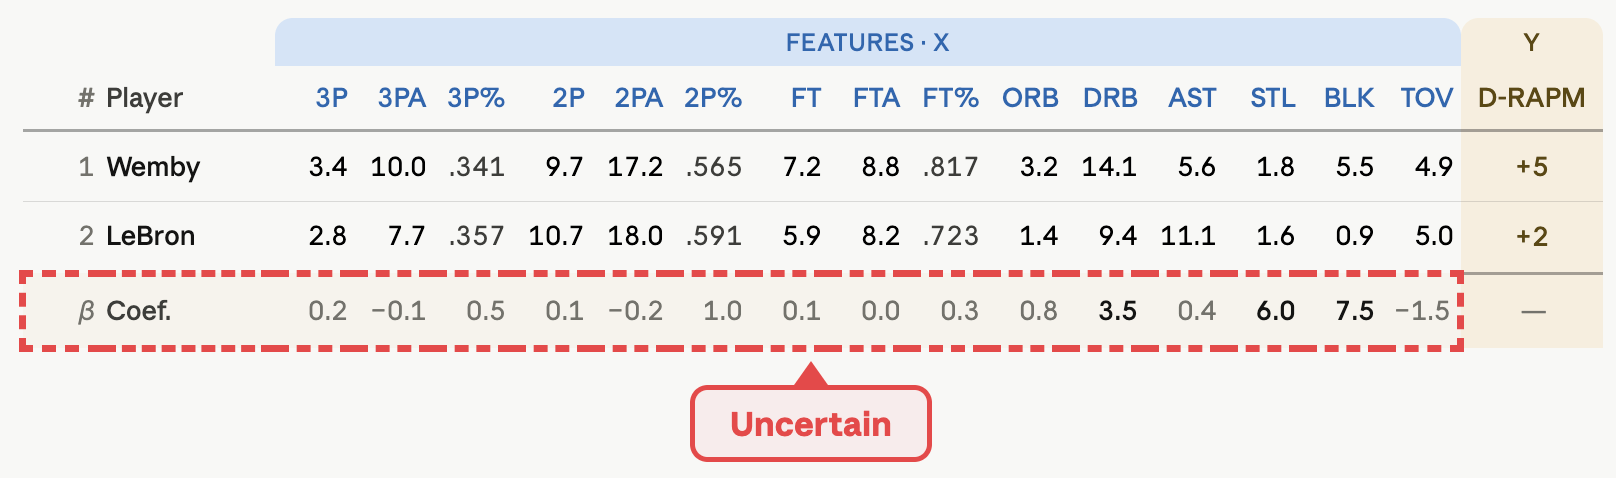
So, what we need to do is compute standard errors for all of our model’s coefficients. This can be done through a technique called bootstrapping.
We essentially run the model a thousand times over, with the following differences:
For each run, we choose randomly which players are part of the model, and which ones aren’t. Players can be chosen multiple times.
From run to run, the model weights will turn out to be slightly different. We can deduce the standard errors of the weights from those differences.
3. The target variable is uncertain
Let’s recall how (almost) all modern box-score metrics generate their weights: A machine learning algorithm finds the best combination of weights so that the resulting box-score player ratings most closely resemble their RAPM ratings.5
But as we noted previously, the RAPM ratings are also uncertain.
In 30-year RAPM, for example, Wembanyama is rated at a +5.2 defensively, with a standard error of 1.1.
Thus, we are 95% certain that Wemby’s true rating exists in a [3.0, 7.4] interval.6
Putting it all together
As we’ve now seen, every step of the process we laid out earlier contains uncertainties that are usually not accounted for. That’s what we’re here to address.
To then create confidence bounds for our metric, we execute the following Monte Carlo method:
For all multiyear stats and every player, we randomly draw new stats, in accordance with the player-specific and stat-specific standard errors we created earlier.
We randomly draw RAPM — our target variable — according to the RAPM standard errors.
We use bootstrapping to create standard errors for the coefficients.
Same as in Step 1, but this time for single-season stats.
We run this setup thousands of times to give us the confidence bounds for our box-score metric.
The results
For predictive purposes, we would normally use specific priors for low-minute players to increase accuracy. For the purpose of this demonstration, these were omitted.
While the ranking isn’t the primary purpose of the article, here are the top 10 players for the 2025-26 regular season in our box-score metric:7
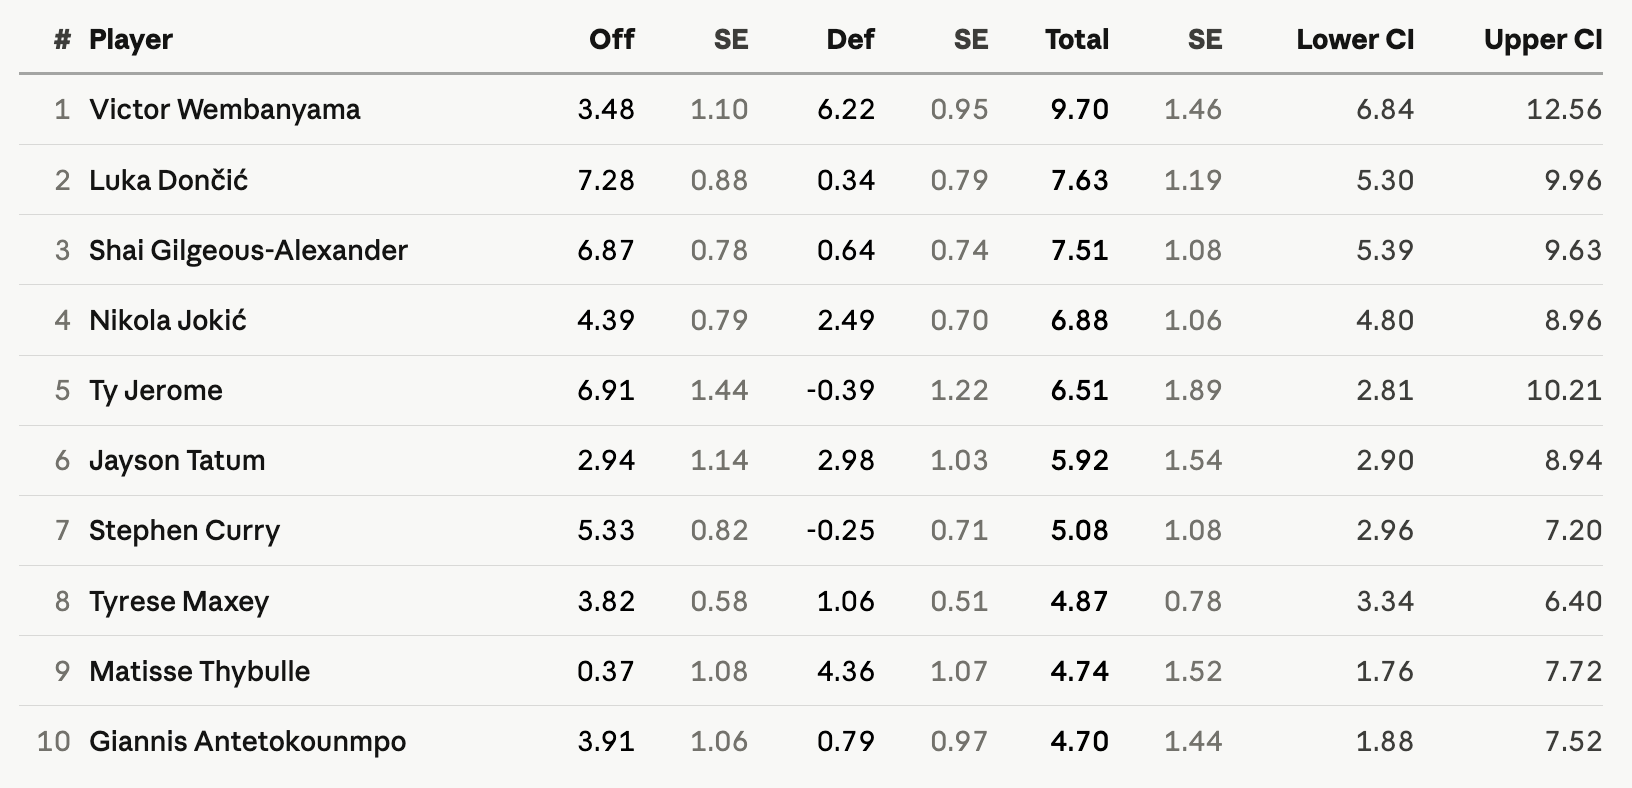
The top four show no surprises.
Fifth-ranked Ty Jerome averaged a blistering 42/6/12 per 100, with a 62% TS% and 42% 3p%.
But Jerome played only 339 minutes in total. Subsequently, his estimate has the highest standard error attached to it. Note that we have standard errors for the offensive, defensive and total rating.
The lowest standard errors generally belong to players that have played the most minutes and have taken a high number of attempts in stats that denote percentages (FT%, 3p%, etc.).
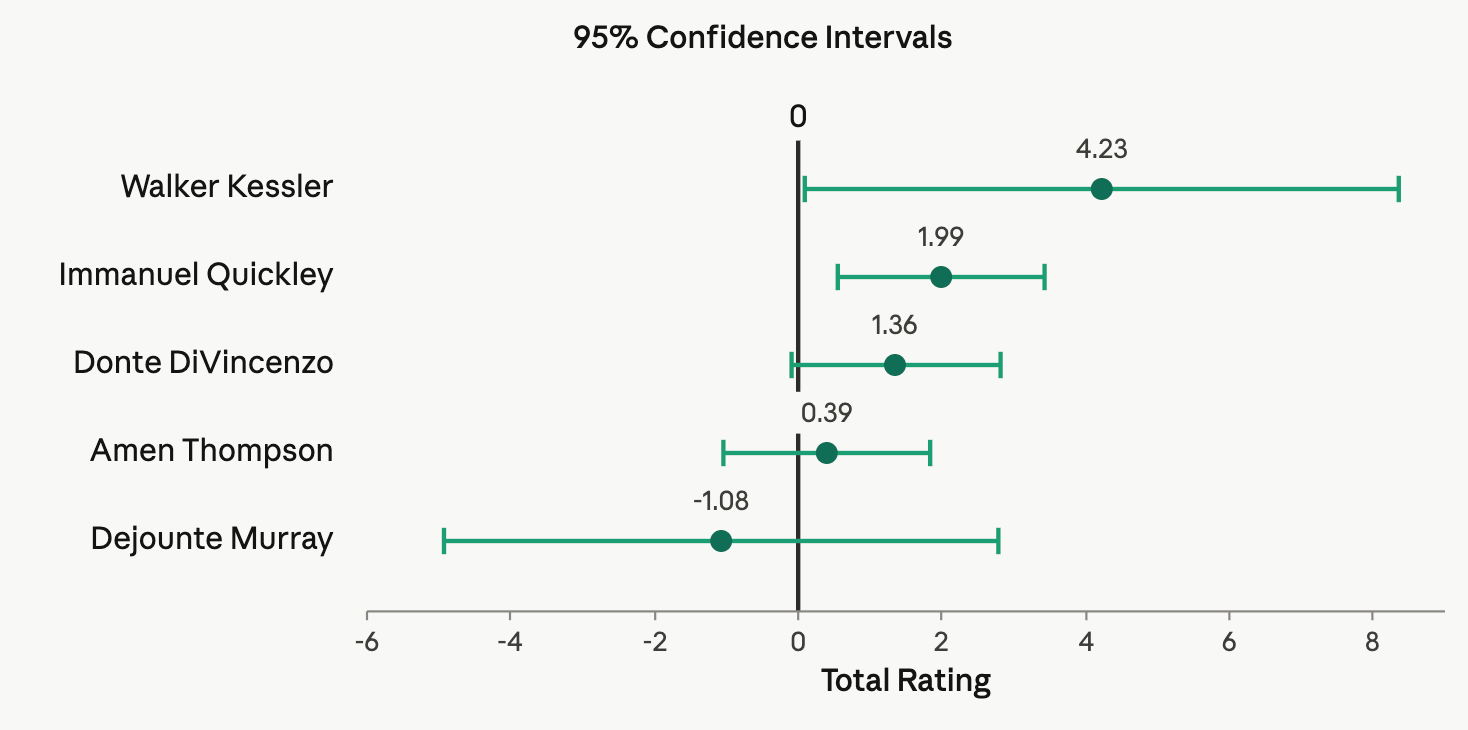
For this last regular season, we are most certain about Amen Thompson’s, Immanuel Quickley’s and Donte DiVincenzo’s ratings. On the other end of the spectrum, confidence intervals are wide for players such as Walker Kessler and Dejounte Murray.
Future work
For the sake of simplicity, we assumed all of the statistics above follow a normal distribution when creating the appropriate standard errors. At least for some statistics, chances are high that this assumption is incorrect.
There are a number of distributions to choose from, several of which might fit certain stats better than the assumed Gaussian distribution.
Our free series of technical articles:


Earlier attempts were missing important ingredients.
Regularized Adjusted Plus-Minus
Career stats since 2016-17.
By minimizing the sum of squared differences, plus an additional term, depending on the algorithm.
To his estimated rating, we add or subtract 1.96 times the standard error to cover 95% of possibilities.
Advanced stats included.
 | A guest post by
|
When resampling the player stats, are you taking into account the dependence structure of box score stats? E.g., if the sampled 3P% is higher than usual, then the sampled PPG should tend to be higher as well.
Also, is the errors-in-variables bias being accounted for at all? Since each player has errors modeled into their counting stats, the estimates of the coefficients are naturally going to get shrunk towards zero. So not only does this affect the width of the intervals, but it also biases the point estimates.